Chatbot Success Metrics: Tracking statistics at every funnel stage
Leading and lagging chatbot statistics
In chatbot conversational marketing we have to measure different chatbot success metrics – leading and lagging KPIs. Leading KPIs show us how the chatbot is operating, whereas lagging indicators report on the business outcome-driven by this marketing channel.
Leading indicators are the upper funnel KPIs and lagging the lower-funnel metrics. In order to measure the success of our chatbot marketing, we need to analyze the entire customer journey:
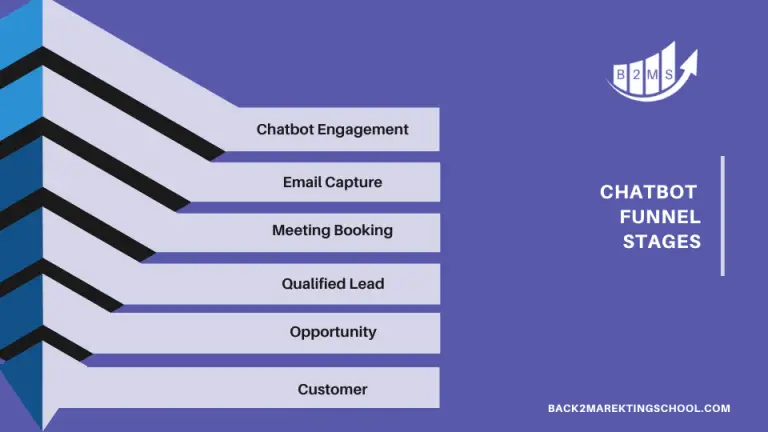
Each stage of the funnel can have an absolute number and ratio to the previous stage. For instance, you can have 90 chat engagements, which equals a 3% engagement rate of 3000 website visitors.
Chatbot operational success metrics
The chatbot performance itself is measured by engagement metrics like chatbot open rates, conversation rates, and meetings booked. They help you to evaluate your chatbot marketing.
Note: For customer service bots, there are also other data points like the number of tickets, waiting time for a specialist, etc. In this blog post, we focus on the lead generation side of chatbot marketing.
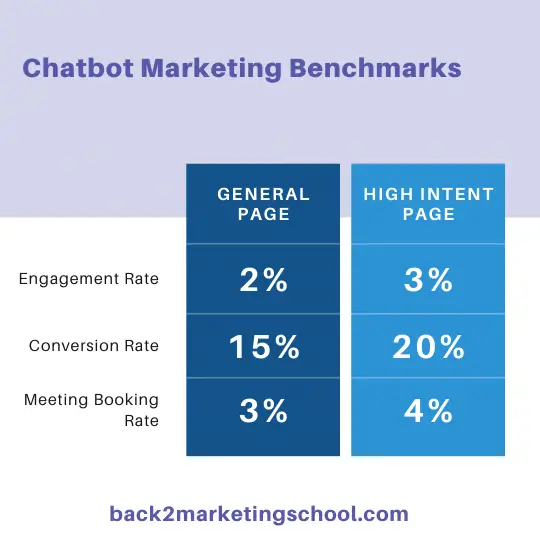
Those chatbot metrics have different benchmarks on different pages on your website depending on the intent of the page. A pricing or contact page has a high intent, whereas a homepage or generic blog post has lower purchasing intent.
3 key chatbot statistics
The three most important metrics in chatbot analytics are the leading lead generation KPIs:
- Chatbot engagement rate
- Chatbot conversion rate
- Chatbot booking rate
The chatbot engagement rate or hook rate is the ratio of the number of times a user is starting a conversation with the chatbot to site visitors who had the opportunity to interact.
The conversation rate is the email capture rate – how many chats result in an email capture?
Next in the funnel is the booking rate which is not relevant to every chatbot. If you just ask for emails but don’t use any meeting booking feature this step can be skipped. However, it’s a great way to bridge the gap to a human meeting.
Improving interaction with your chatbot
Based on these three key performance indicators you can optimize the interaction rates with some chatbot marketing hacks, like conditional branching for returning visitors, changing the order of questions, or personalizing the experience.
Keep in mind that improving one metric in the funnel could lead to a big improvement at the bottom. If you increase the chatbot open rate from 2% to 3% and your conversation rates within the funnel stay consistent, you can also capture 50% more leads.
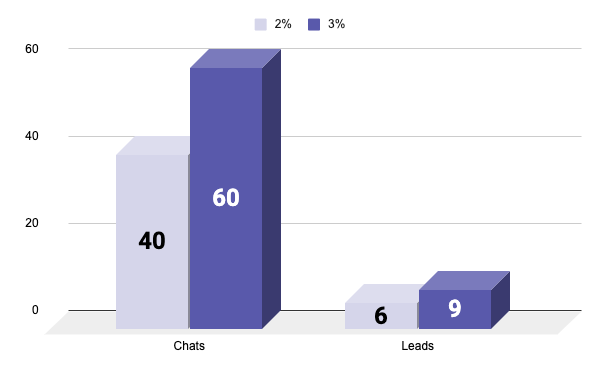
This graph shows the jump in leads based on 2000 website visitors and increases from a 2% chatbot engagement rate (40 chats) to 3% (60 chats) and a consistent 15% email capture rate.
Chatbot lead quality
Maybe a fourth important KPI in the upper funnel is lead quality. How many leads are good leads for the business? Now we need to distinguish how you qualify a lead as “qualified”, and which stage you assign. A Marketing Qualified Lead (MQL) could be everyone that’s somewhat interested or a real business lead.
Regardless of how you define that stage, you can measure lead stages like MQL, SQL, or SALs. Chatbots make it easy to ask qualifying questions and incorporate further signals like the number of sessions, or pages visited into the equation.
Chatbot vs form
When we talk about channels we don’t refer to Google Ads vs Facebook Ads or Organic Traffic, we refer to lead capture channels. Those channels are mainly contact forms, email inquiries, or inbound phone calls.
However, most times in inbound marketing we need to compare chatbot to form submissions. In order to measure your chatbot’s performance, it’s not enough to look at just the chatbot success metrics but also form fill statistics. Usually, form fills are measured solely by conversation rates, but could also report on form abandoned rates. A form is abandoned when someone starts to fill in information but doesn’t submit it.
A rule of thumb is that a chatbot should double your website conversion rate. If your current rate is 2% with a contact form, this rate should jump to 4% between the chatbot and contact form.
Lagging chatbot success metrics
Your Chief Revenue Office doesn’t care for any of the leading, operational chatbot statistics, she cares for business metrics like generated pipeline and revenue values.
Every good CRM can track opportunities/deals back to its lead source. HubSpot Deals can take the lead source directly from their own chatbot feature in their Marketing Hub. Marketo and Salesforce have many integrations to chatbot platforms like Drift or Tidio.
Lagging chatbot marketing reports should report on the following:
- Number of opportunities generated: How many deals have the chatbot as a lead source
- Pipeline value generated: How much money could those opportunities bring in
- Average opportunity size: What the average how does it compare to other opportunities
- New deals closed: How many new clients were won from the chatbot lead source
- Revenue generated: How much revenue did these clients generate
- Avg. deal size
- Avg. time to close: How long did it take to close the deal and how does this number compare to other channels
- CLTV of chatbot generated clients: What’s the customer lifetime value of the new clients and how does it compare to other channels
Further operational chatbot statistics
Of course, chatbot marketing can report on more metrics than mentioned in this post. You could report on active users, the number of messages, retention rate, or satisfaction rate. But all those metrics depend on your business and are even more operational than the discussed key metrics.
Next on your Marketing School Curriculum

Sascha is a Lifecycle Marketing Consultant with over 8 years of digital marketing experiences in Silicon Valley, the UK, and Germany.
After leading the demand generation for a 100+ million company, he decided to venture out on himself. He’s now helping clients to attract and convert more leads and customers.
His main focus are SEO, paid media & marketing automation – all with the focus to tie marketing campaigns to revenue.
Sascha has been featured in industry publications.