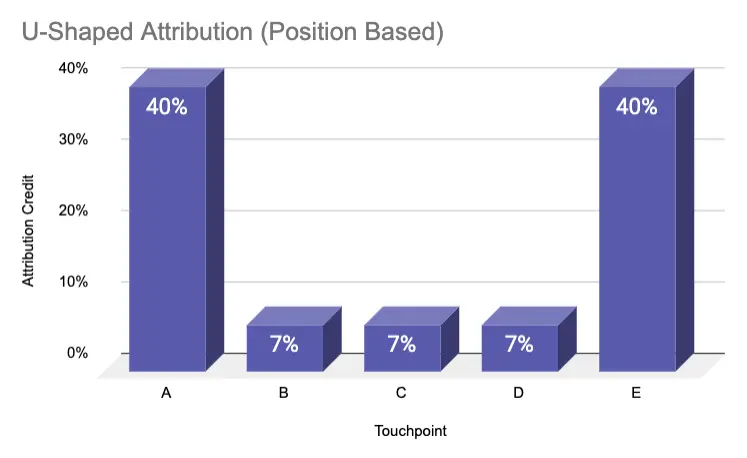
How to achieve a better ROI with the U-Shaped Attribution Model

Revenue attribution is challenging. In order to understand which campaigns are better performing than others, we use marketing attribution models. The U-shaped attribution model is one of these instruments that can help us to understand the customer journey.

u shaped position based attribution model

What is the U-shaped attribution model?

The U-shaped attribution model is a marketing analytics approach that assigns credit to each of the touchpoints in a customer’s journey. It takes into account both the short-term and long-term effects of each touchpoint, giving you a more comprehensive understanding of how your marketing campaigns are performing.

By definition, the U-shaped attribution is a position-based multi-touch attribution model.

The model got its name based on the form of the attribution graph. Related position-based attribution models are the W-shaped or Z-shaped models.

w shaped position based attribution model
z shaped position based attribution model

How does the U-shaped attribution model work?

The U-shaped attribution model gives the majority of credit to the first and last touchpoint in the buying journey before someone becomes a customer. The first and last marketing interaction receive 40% each. The remaining 20% are split between the touchpoints in between.

U-shaped attribution example

Let’s assume a user clicks a Facebook ad as the very first touchpoint with your brand. Next, the user receives a remarketing message that brings her back to the website, conducts an organic search, and lands on a blog post. After that, the user comes back a fourth time by directly visiting the website and finally becomes a customer after clicking a Google Ads search advertisement. The attribution looks as follows:

  1. 40% Facebook ad
  2. 6.7% Remarketing ad
  3. 6.7% Organic search
  4. 6.7% Direct visit
  5. 40% Google search ad

Advantages of the U-shaped attribution model

The methodology of the U-shaped attribution model is to give the majority of credit to the first and last touchpoints. Hence, it emphasizes the two touchpoints that would get 100% of the attribution in the first-touch- or last-touch-attribution models (single-touch attribution).

It also expands on this and gives partial credit to each touchpoint in between.

This allows marketers to better understand which marketing campaigns drive the most valuable conversion action – the first contact and last customer interaction.

Another advantage is the diffusion of a disadvantage of the linear multi-touch attribution model. This model allocates credit evenly across all touchpoints, regardless of their impact.

With the U-shaped attribution, we don’t overemphasize touchpoints that don’t move the needle.

Lastly, it’s fairly easy to understand the model and implement the attribution reporting. That’s why it’s even applied to complex B2B marketing attribution reporting.

Disadvantages of the U-shaped attribution model

As with every model, the U-shaped attribution also has its cons. First, the model simplifies the customer journey. It also doesn’t take the time into account that passed between the first and last touchpoint. For example, let’s look at the above illustration again. If someone saw a first ad and then remarketing ad within a short time frame, but then a year passes between the second and third touchpoint, are the Facebook and remarketing ad still relevant for the purchase decision?

u shaped position-based multi-touch attribution

Comparison of attribution models (with an example)

In order to better understand the U-shaped attribution, we also need to see the impact of other models. For better illustration, we will use the same example as previously.

(If you need a refresher on how each of the models works, check out our marketing attribution guide)

Touchpoint

Facebook Ad

Remarketing Ad

Organic Search

Direct Visit

Google Search Ad

First Touch

100%

0%

0%

0%

0%

Last Touch

0%

0%

0%

0%

100%

Linear

20%

20%

20%

20%

20%

U-Shaped

40%

6.7%

6.7%

6.7%

40%

W-Shaped

30%

5%

30%

5%

30%

Time Decay

5%

10%

15%

30%

40%

Data-Driven

15%

5%

25%

20%

35%

As you can see, each attribution model allocates – at times very – different recognition to each channel or campaign.

It’s for us marketers to learn how to analyze and take action from the insights. No model can increase your marketing performance.

When to use U-shaped attribution (and when to avoid it)

If you are selling items of lower value and require a simple outline for your buyers’ funnel, then adopting a U-shaped model is the perfect solution. Furthermore, if customers generally convert after just few interactions with your brand, then it’s truly crucial to prioritize the first and last touchpoints – while other details may be interesting to analyze, they don’t necessarily hold much importance in this case.

When to avoid the U-shaped multi-touch model?

Companies selling expensive products with a long sales cycle should avoid relying on a U-shaped revenue attribution model, as it places too little emphasis on customer nurturing. Instead, they should opt for a strategy that provides prospects with the right amount of touchpoints to ensure their needs are met.

In the above case, marketers can use the U-shaped model in addition to other approaches and reports to also focus on high converting touchpoints.

Conclusion

The U-shaped attribution model has been gaining popularity in the marketing world. It gives more credit to both the first and last touchpoints, while still offering some value to the touchpoints between them. This allows marketers a better understanding of which campaigns are driving conversion action.

This model can be useful for companies selling lower-value items or products that require few interactions to convert. Companies selling expensive items or products with longer sales cycles should opt for other models that place more emphasis on customer nurturing.

Overall, it is important to remember that no one model can increase your marketing performance, but instead marketers need to learn how to analyze and take action from insights provided by the reports.